Hello and welcome to the virtual home of House of Many Colors.
We are Celeste and Rick Glover. Thank you for visiting our site.
If you are looking for a way to get an above average return on investment (R.O.I.), backed by a solid asset (real estate), and without the typical challenges of being a landlord, you’ve definitely come to the right place!
Please take a few minutes to explore our website, watch our short videos and see what we do here at House of Many Colors.
We believe that real estate investing, done properly, in an educated and logical manner is the best investment available for the average person.
That doesn’t mean it’s easy. We work hard to do it right.
Here are a few of the challenges prospective investors face:
- How to learn all the in’s and out’s of investing in properties.
- Finding the right market to invest in and at what time.
- Choosing the right investment strategy and the appropriate kinds of properties to buy.
- Creating a solid, experienced and effective real estate POWER TEAM.
- Managing the deal during acquisition, managing the property upgrades and following through with a profitable, timely exit strategy.f
 Fortunately for our investors, we take care of all of this. It’s what we call a hands-free investment for our investor partners.
If you aren’t already on our prospective investor contact list, you are welcome to join us and be the first to know when we have exciting and profitable investment opportunities available. Just fill out your contact information in the box at the right of the screen.
When you are ready to find out more about our investment program, we invite you to contact us directly. We will be happy to show you exactly how it works either in person, by phone or on-line.
Again, welcome to the site. We look forward to talking with you personally.
Celeste and Rick Glover



Multi-Family Investors:
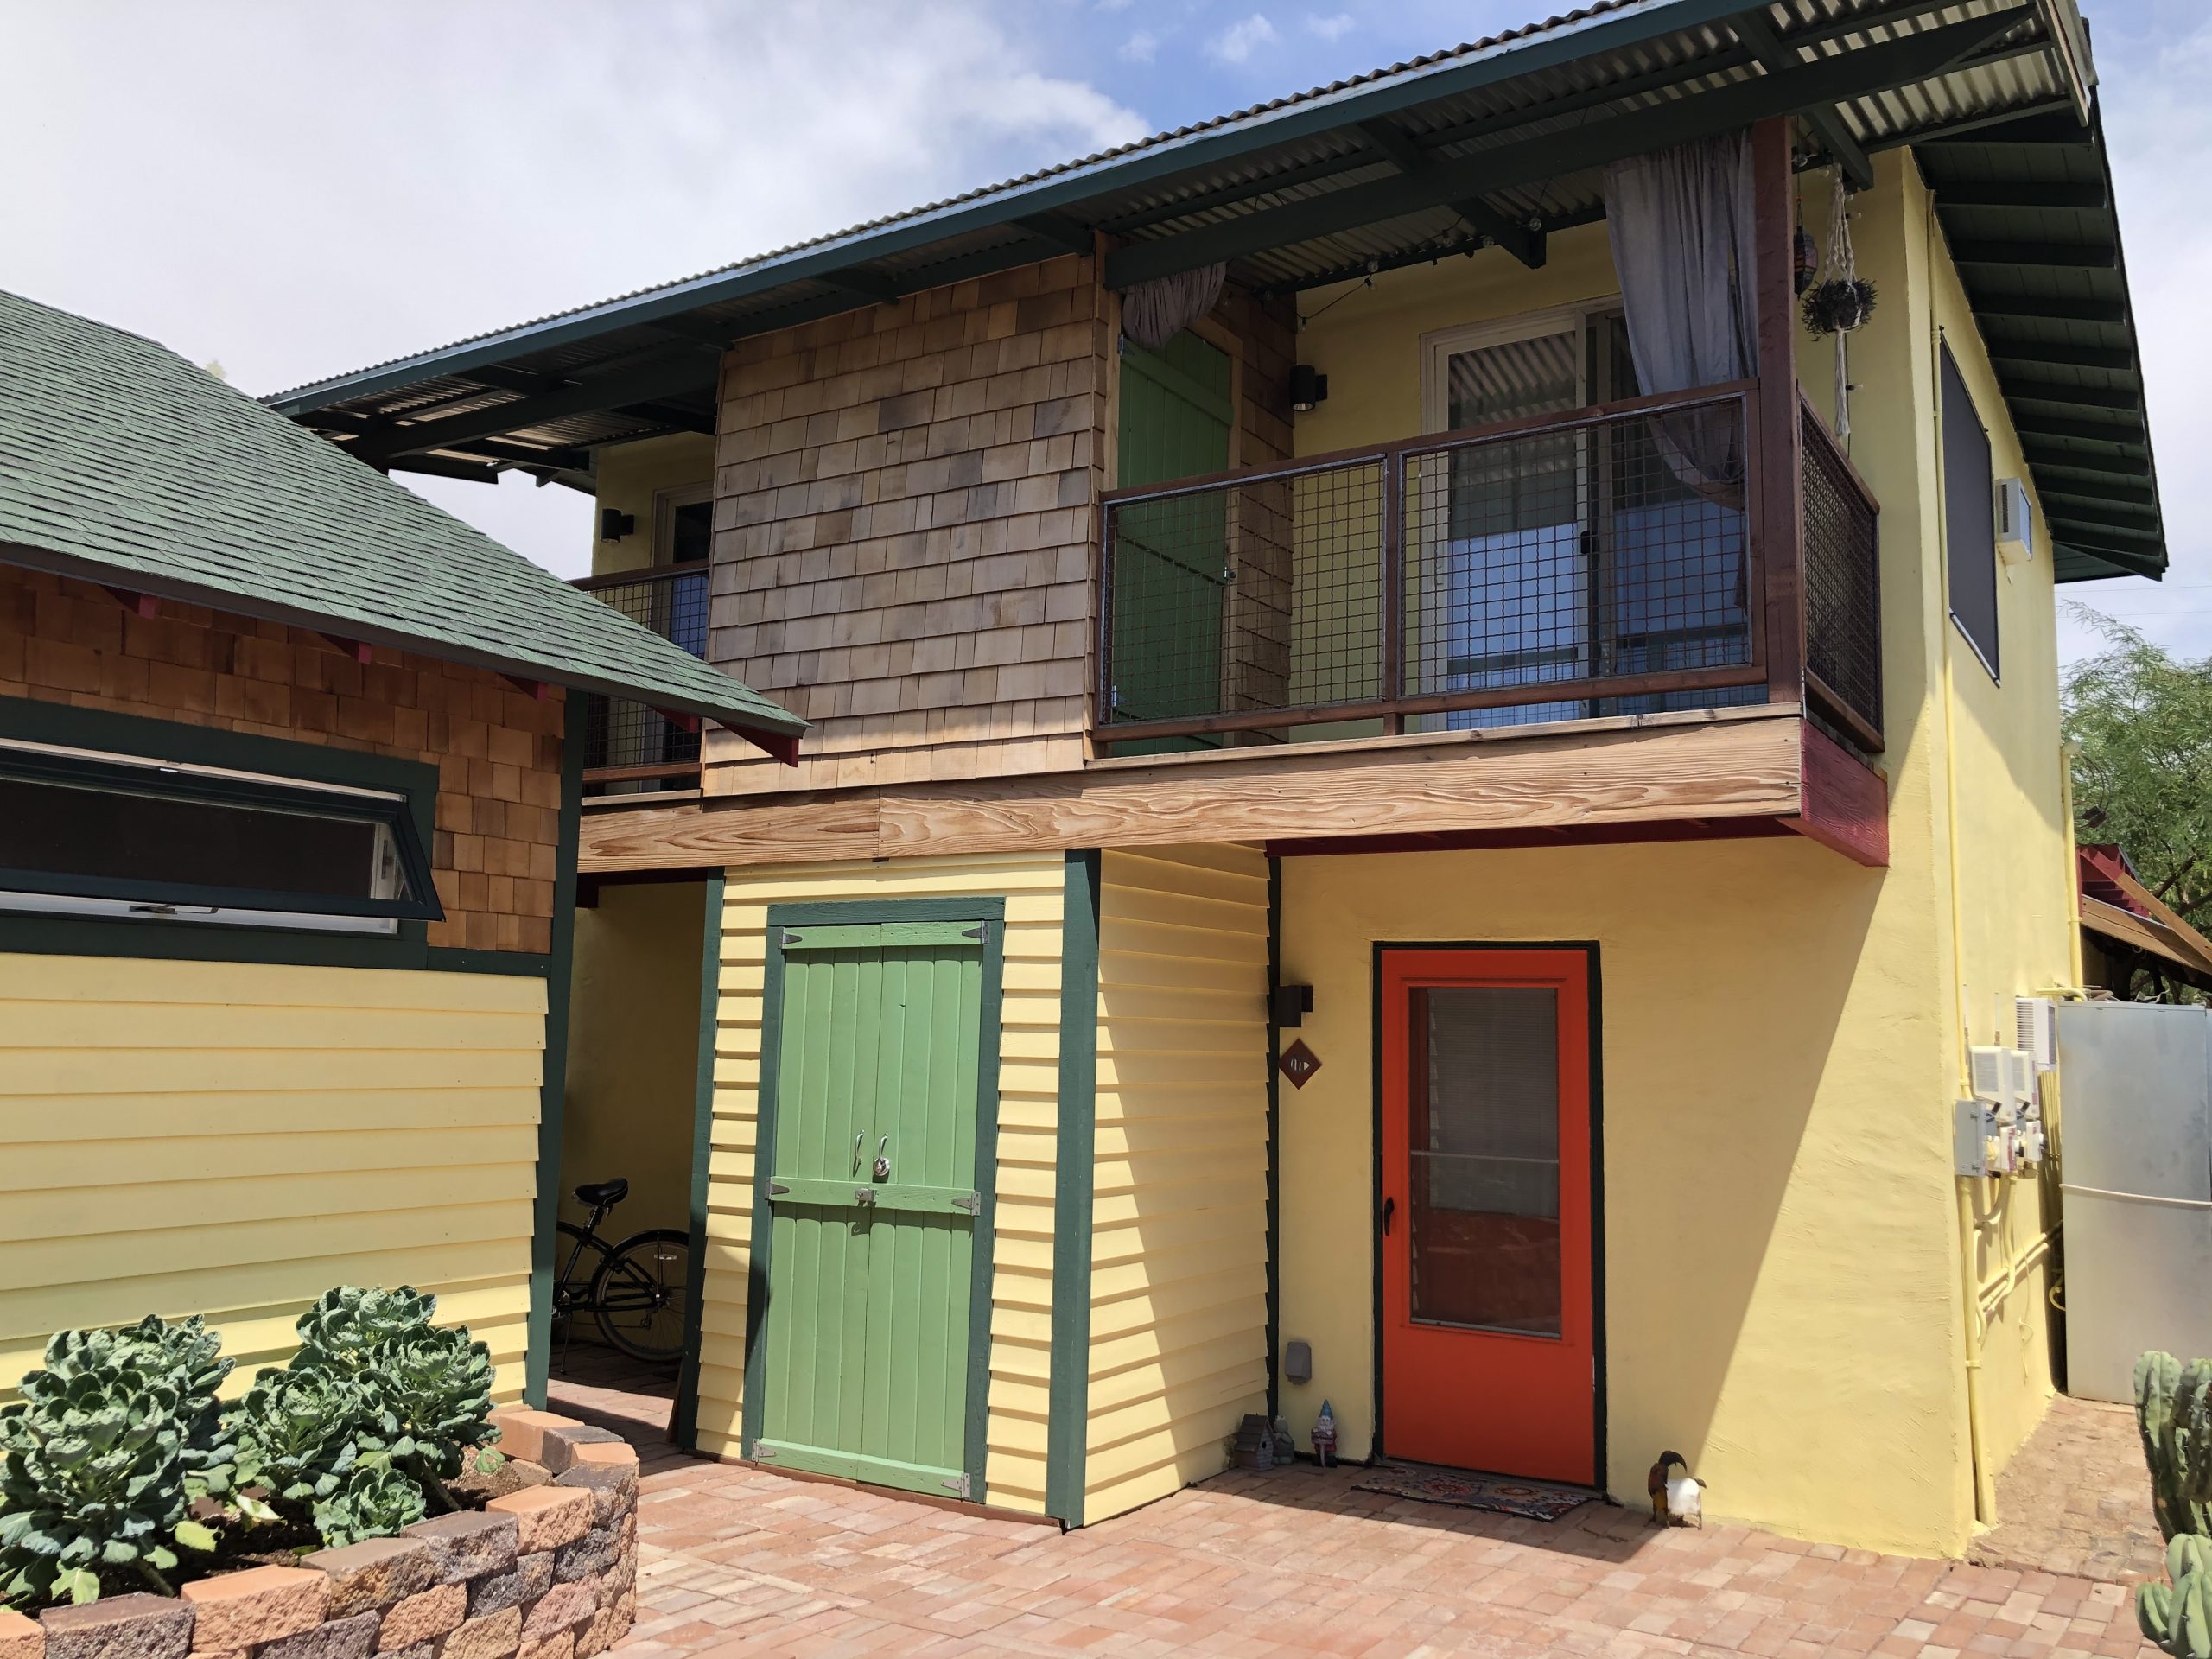
Who are we? House Of Many Colors is a real estate investment company. We have been actively investing in Maricopa County real estate for a number of years. Our mission is to provide quality housing for quality tenants while providing an above average return on investment (R.O.I) for our investor partners and ourselves. It is truly a win-win-win way of investing!
If you aren’t already on our prospective investor contact list, you are welcome to join us and be the first to know when we have exciting and profitable investment opportunities available. Just enter your contact information in the box at the right of the screen. This will also give you access to a short video called “Why Real Estate is An Exceptional Way To Invest“.
If you are ready to find out more about our investment program, we invite you to contact us directly. We will be happy to show you exactly how it works either in person, by phone, or online.

What Do We Do?
We focus primarily on Multi-Family properties to provide good local people with quality housing. At the same time getting an above average return on investment for our investor partners and ourselves .
LATEST BLOG
Real Estate Vs. Stocks: What 145 Years Of Returns Tells Us
Over 145 years, stocks and real estate performed well. But is one better than the other?
Updated on March 10, 2023.
Let’s get one thing straight: everyone should hold both stocks and real estate in their portfolios. Diversification is the ultimate hedge against risk.
But that doesn’t mean we can’t pit stocks and real estate against each other in a classic Mortal Kombat-style matchup. Which earns the best return on investment: real estate or stocks? And while we’re asking this grandiose question, which investment is safer?
The Latest Data
There’s a sweeping study done by several U.S. and German universities and the German central bank that analyzed data from 16 countries over a 145-year period. It’s a fascinating study, and we’ll get to it in a moment. But it comes with a downside: it only includes data through 2015.
So before we dive into the best data, let’s look at more recent — but less comprehensive — data.
Stock market performance
Fortunately, it’s easy to find clear stock market data.
Over the 45 years from January 1978 through December 2022, S&P 500 averaged an impressive 11.53% return. That includes both dividend income and price gains.
But less impressive is the volatility in the stock market. Take a look for yourself:
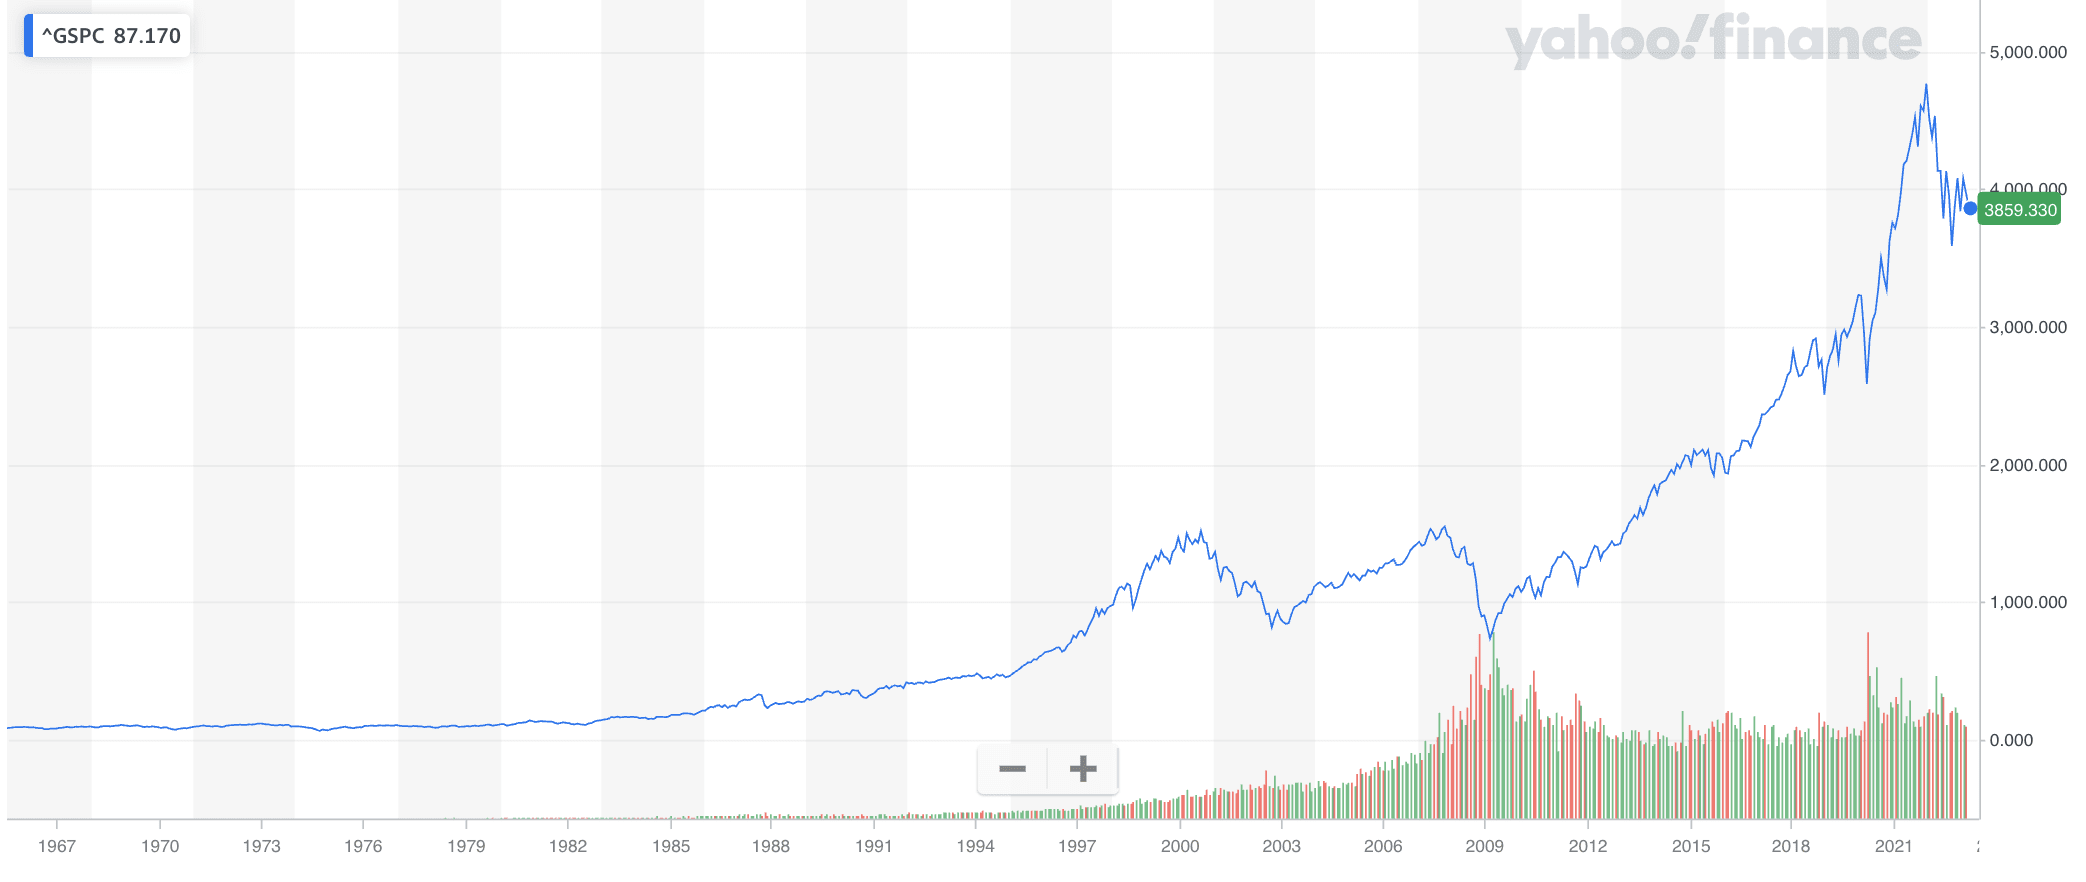
More on volatility later, but it marks one of the primary risk factors in any investment.
For reference, Treasury bills returned an average of 4.3% during that time period.
Commercial real estate performance
The National Council of Real Estate Investment Fiduciaries (NCREIF) compiles the best data on real estate investments in the U.S., going back to 1977. Their data includes over 35,000 privately-owned commercial properties (from office buildings to apartment complexes to industrial and beyond), plus over 150 open- and closed-end funds owning real estate.
Over that same 45-year period from January 1978 through December 2022, the NCREIF Property Index (NPI) has averaged an annual return of 9.03%. For additional context, the NAREIT all equity index of publicly-traded U.S. REITs averaged 11.58% in that time.
As with the S&P 500 return documented above, those index returns include both income and appreciation.
So how does residential real estate measure up?
Residential real estate performance
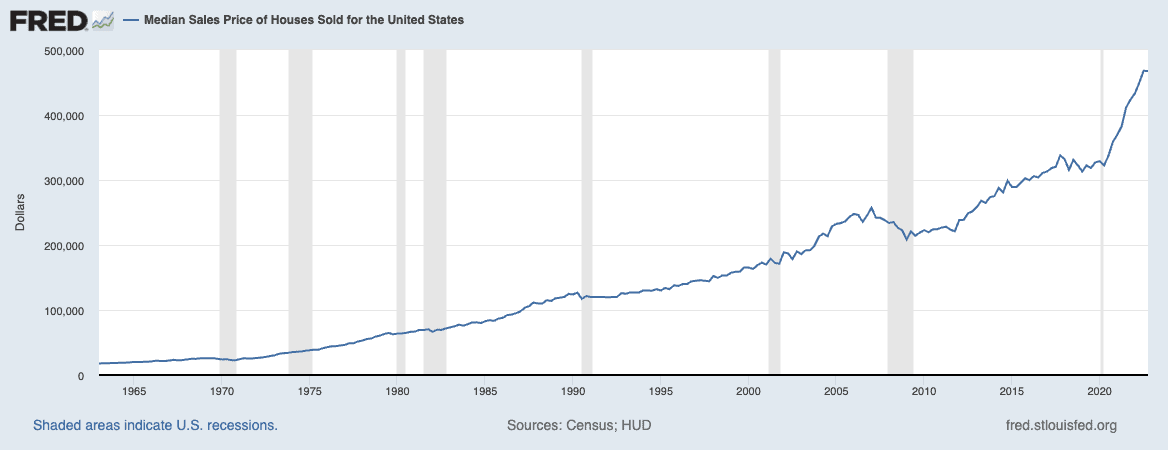
The data is less clear for residential real estate. A report from Real Estate Witch found that home prices have increased 7.6 times faster than income since 1965, showcasing just how well residential properties have performed in recent decades.
But residential real estate returns include rental income, not just price growth. Unfortunately, there are precious few reliable resources that include both income and appreciation.
Fractional rental investing platform Arrived did a 20-year study in late 2021 that found that residential U.S. real estate returned an average of 11.7% — sort of. They included financing when running those numbers, which distorted the total return to look higher. Removing leverage, that number drops to 9.5%.
Sources citing Standard & Poor’s claim that residential real estate averages a return of 10.6% over time, but I couldn’t find the original data to verify that or even determine what time frame that figure refers to.
You can see why the 145-year study is so valuable, given how unreliable other data on residential real estate returns is.
As a final thought, compare the stability in home prices to the volatility of stock prices:
The 145-Year Study
A team of economists from the University of California, Davis, the University of Bonn, and the German central bank set out to answer these questions by analyzing a stunning amount of data collected over a 145-year period of time.
The lead authors of the study — Oscar Jorda, Katharina Knoll, Dmitry Kuvshinov, Moritz Schularick, and Alan M. Taylor — reported the findings of their massive study in a paper entitled “The Rate of Return on Everything, 1870-2015.” In it, researchers looked at 16 advanced economies over the past 145 years to find what offers the best return on investment. They compared returns on several asset classes, including equities, residential real estate, short-term treasury bills, and longer-term treasury bonds.
To better compare apples to apples, with each asset type, they adjusted for inflation and included all returns, not just appreciation. Dividend income was included for equities, and rental income was included for residential real estate.
Their findings, in short: Residential real estate was the better investment, averaging over seven percent per annum. Equities weren’t far behind, at just under seven percent.
Then came bonds and bills with a far lower rate of return, surprising no one.
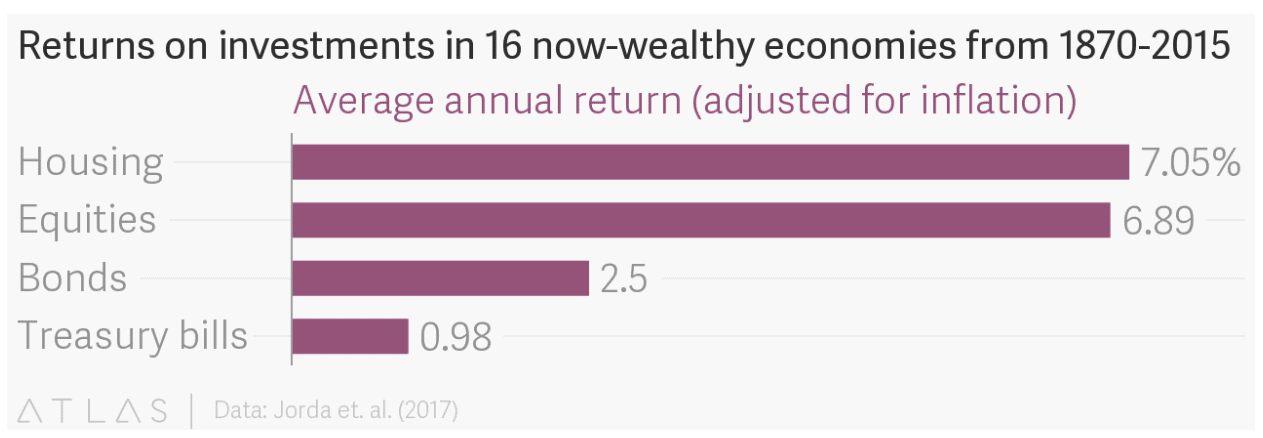
Real Estate vs. Stocks: Average ROI
Rental income proved an important factor — roughly half of the returns on real estate investments came from rental income, while the other half came from appreciation.
Stock investments and investment property each performed differently in various countries, of course. Here’s a comparison of each of the 16 countries:
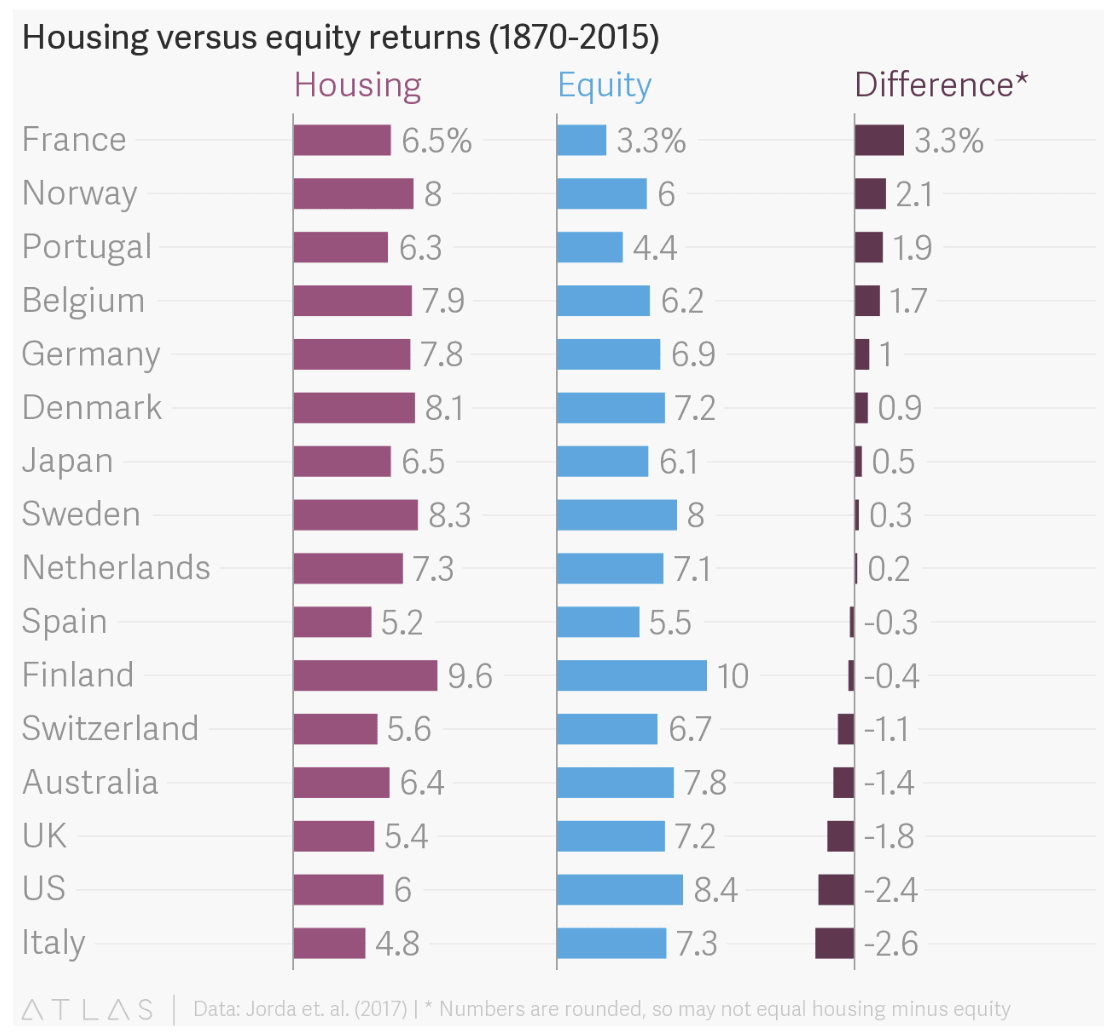
Keep in mind that these are long-term return averages over the course of many decades. In real time, these returns bounced up, down, sideways, and in circles.
Here’s a curious little chestnut for you: From 1980 to 2015, the stock market, on average, performed significantly better than real estate investments. Across the 16 countries studied, stock investments earned an average annual rate of return of 10.7 percent, decisively beating the real estate market’s stolid 6.4 percent.
Should we all sell our rental property and move our money into a Vanguard account?
Of course not. But the reasons are multiple and a bit nuanced.
First, a few outlier countries threw off the average return on investment from the time period between 1980 and 2015. Japan saw its real estate markets collapse as its population aged. And in Germany, residential real estate has been stuck in the slow lane for decades.
Meanwhile, stock investments in Scandinavia have exploded.
But the most interesting case for real estate investing lies in its risk-reward ratio.
Risk by Asset Class
Let’s do a quick stereotype check-in, shall we?
Treasury bonds are low-risk, low-return. I don’t think anyone’s prepared to challenge that stereotype, which exists for a reason.
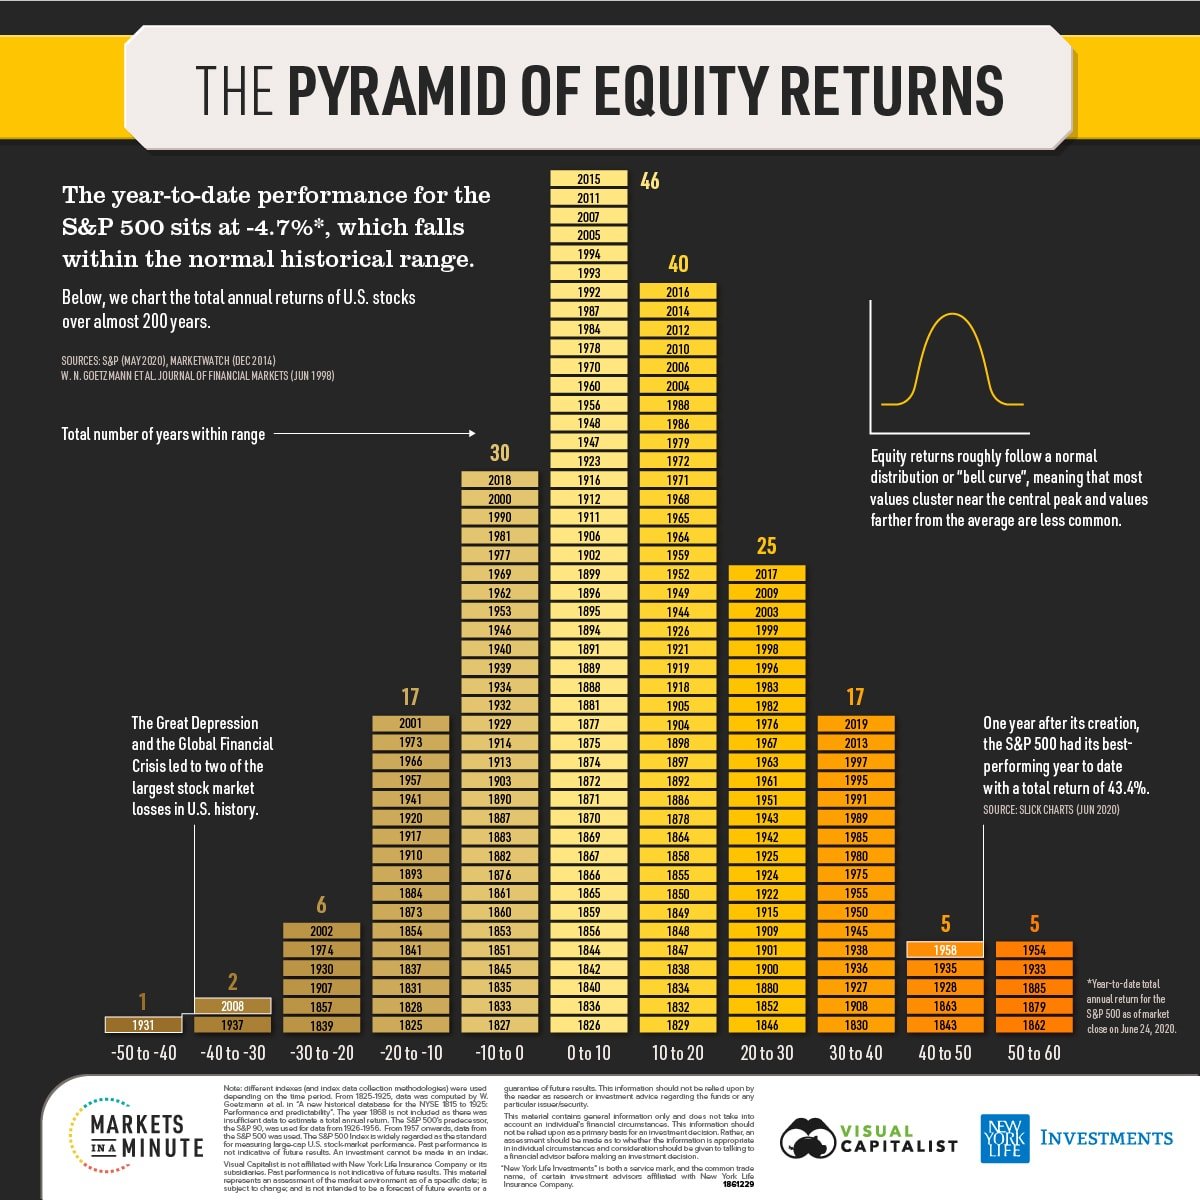
Stock investments are high-risk, high-return. This one gets a little more interesting, but a quick look at how stock markets have gyrated for the last century — up 29 percent one year and down 18 percent the next — should disabuse anyone of the notion that stock investing doesn’t come with high volatility and risk.
And that brings us to an economic assumption that dates back to, well, the beginning of economic theory. Economists have long held as a given that risk and returns are highly correlated and that “the invisible hand” of the market will ensure that remains the case.
Why? Because if an asset were low-risk, high-return, everyone and their mother would fling so much money at it that the rate of return would dry up faster than Lindsay Lohan’s acting career.
Except, that assumption hasn’t held true for residential rental properties.
Rental properties: low-risk, high-return
Throughout modern history, residential real estate investors may actually boast the best return on investment, thanks to its extremely high rate of return with low risk. Take a look at volatility for real estate versus stock for the past 145 years:
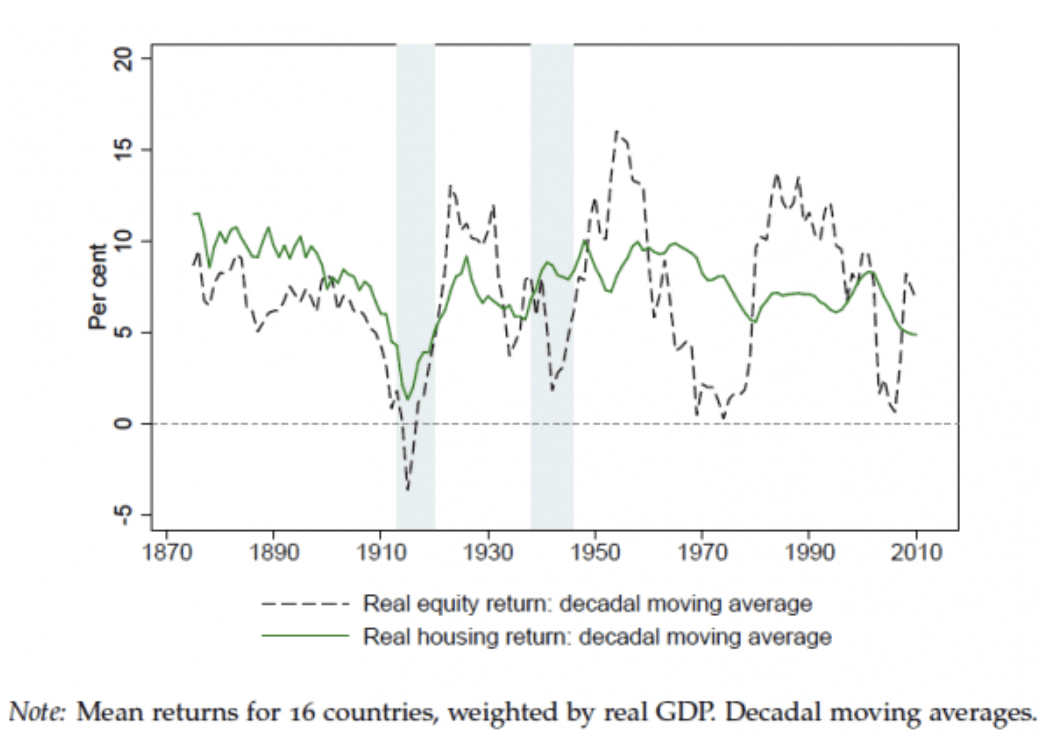
To begin with, real estate is also notoriously illiquid. You can’t buy it and sell it on a whim — either process typically takes months.
Second, real estate investing is expensive. Until the past 15 years, with the advent of crowdfunding, you couldn’t invest your extra $100 a month to buy an investment property.
Even if you leverage to the hilt and borrow the maximum mortgage allowed at a low-interest rate, that still usually puts you at a 20% down payment, plus thousands of dollars in closing costs, which says nothing of credit requirements, income requirements, and/or lenders’ requirements for investing experience.
In other words, real estate investing has a high barrier to entry.
It’s also difficult to diversify your investment portfolio for those very same reasons. If each asset requires $20-100K in cash to purchase, then it takes a lot of money to build a broad, diverse real estate portfolio.
Rental properties also come with risks from tenants. Tenants could damage your property or default on rent. But you can manage these risks through aggressive tenant screening and insurance policies (including rent default insurance).
You can also manage risk by choosing your locations and investing niche with care. For example, imagine you invest in student housing in college towns. You could choose college towns with both affordable real estate and massive demand for off-campus housing. A study by Porch.com found that Rhode Island, Maine, and Illinois boast the most savings for college students living off-campus, creating a huge demand for off-campus student housing. In these states, off-campus housing prices are 37%, 26%, and 25% lower than on-campus housing, respectively. (Check out Providence, Rhode Island, for a particularly good example.)
Finally, rental properties offer fantastic tax breaks. If you live in the property and house hack, you can write off mortgage interest and exclude up to $500,000 of net gains through the Section 121 exclusion. You can also deduct depreciation on your investment portfolio, use 1031 exchanges to defer taxes on the sale of any rental-only properties, and a dozen other tax perks besides.
Measuring Risk vs. Return
How do you measure an investment’s risk against its rate of return?
It turns out there’s a simple way to determine the best return on investment: a literal risk-reward ratio. It’s called the Sharpe ratio after its creator, William Sharpe.
You start with an asset’s return and subtract out the return of a short-term, risk-free alternative (like U.S. Treasury bills). That gives you a “risk premium” — the extra return the asset delivers over a risk-free investment.
Then you simply divide that “risk premium” over the asset’s volatility, as measured by its annual standard deviation in value:
Risk premium / average annual standard deviation
If the math gives you a headache, don’t worry about it. Just think of it as return divided by risk. A higher ratio indicates a better investment — greater return on investment relative to the risk. Here’s the breakdown:
- Treasury bonds: Their Sharpe ratio of around 0.2 is weak sauce.
- Stock investments: Not much better, at 0.27. Sure, their returns were strong, but they’re more volatile than plutonium in a mad scientist’s lab.
- Residential real estate: The average Sharpe ratio of 0.7 is great.
The Sharpe ratio for real estate has only grown stronger over time. Since 1950, the Sharp ratio for real estate has averaged an impressive 0.8.
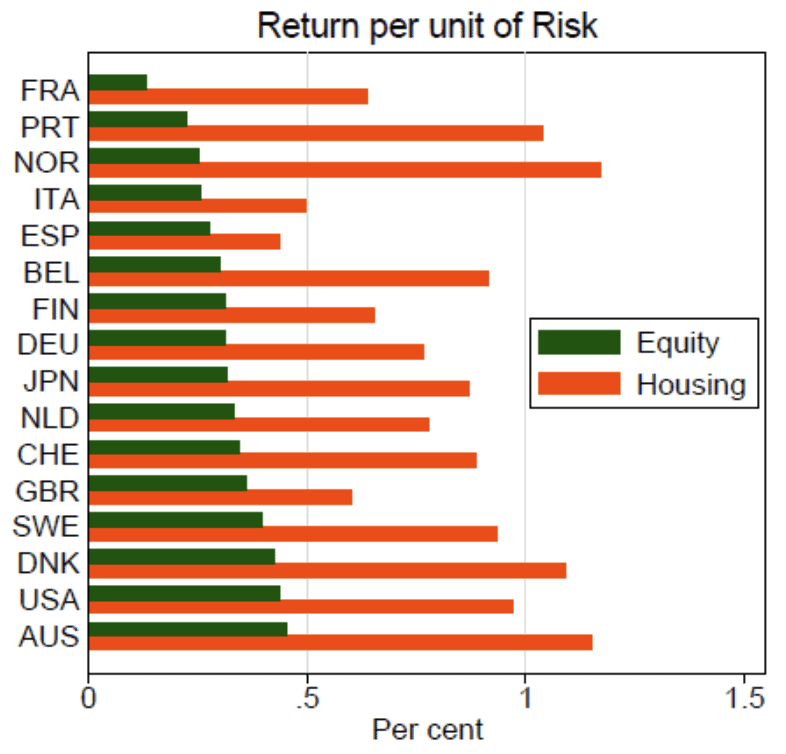
Another way of looking at it is return per unit of risk — here’s how stock investments have compared to real estate in each of the 16 countries studied:
Rate of Return and GDP
Advanced economies tend to have slow economic growth over any given period of time, right? So how have returns done so much better than the GDP growth in these countries? Aside from the obvious issue that these economies looked very different in 1870 than they do today, there’s an interesting answer to this query.
It turns out the best return on investment for a country isn’t tied in a 1:1 relationship with its GDP. Over time, returns on these asset classes tend to grow on average around double the speed of the country’s economy as a whole, measured by GDP.
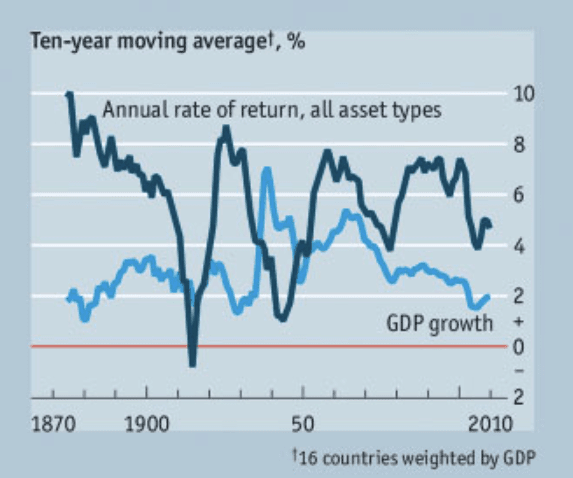
If anything, that “returns average double GDP growth” summary is skewed low because it includes the weak return on investment of bonds and bills. On average, the stock market and real estate market perform several times better than GDP growth.
This helps explain why income inequality tends to expand over time in advanced economies. Average Joe does not own stock investments, and if he owns any real estate, it’s his primary residence — a single-family home that he probably only earns appreciation on with no rental income (and remember, rental income makes up half of real estate investment returns!).
So, how does Average Joe improve his finances? Only through a raise. His raise is tied to how his employer is doing, which, in turn, is tied to how the economy is doing.
In other words, Average Joe’s finances are tied to GDP growth.
But Wealth-wise, Wendy, who’s not nearly as average as Joe, invests as much money as she can in the stock market and rental real estate. She builds a portfolio of passive income that earns money even while she sleeps. That income is based on the rate of return of her investments, not based on the economy.
Coupled with the impressive tax benefits enjoyed by those with an investment property? Wendy’s financial advisor undoubtedly sings her praises.
Conservatives and liberals can argue all they want about how much to redistribute wealth. But as an individual, you want to be like Wendy, not Joe. You want your wealth and income tied to the returns of the stock market and real estate investments, not tied to GDP.
Why Real Estate Investments Crush Bonds
Bonds are boring.
No, really. We already talked about how they’re low-risk, low-return. Why bother with this asset class if you can invest in rental properties, which are low-risk and high-return?
A common opinion I hear people say is, “Bonds may not have performed well over the past 15 years, but that’s abnormal! Just look at how well they did in the ’80s!”
Interestingly, this new study disproves that notion. The high bond yields of the 1980s were actually the anomaly, not the norm. In fact, if you look at bond returns over the past 145 years, there were many periods where they earned negative returns.
Want a few reasons why rental real estate offers the best return on investment compared to bonds?
Here’s a simple one: bonds expire. They pay out for a specific term, then they stop paying. Rental properties keep paying forever.
And not only do they keep paying indefinitely, but they also pay more over time. With every year that goes by, fixed bond payments become less valuable in real purchasing power due to inflation. But rental income and property value rise right alongside inflation.
It’s actually your fixed mortgage payment that goes down over time in inflation-adjusted dollars! Then one day that mortgage payment disappears, and your rental cash flow explodes.
Sure, government bonds offer stability compared to index funds, individual stocks, and even rental properties. Bonds pay the same amount every month. They never call you about a leaky roof or stop sending payments because they spent too much on cigarettes and Bud Light that month.
But at what cost in returns?
If retirement looms on the horizon for you, familiarize yourself with sequence risk and how owning rental property affects the 4 percent rule, so you don’t necessarily have to resort to bonds.
Should I Ditch Stocks and Just Buy Rentals?
Stocks may be a roller coaster, but in the long run, the good times outweigh the bad. And ultimately, finding the best return on investment requires a diversified portfolio. Stocks balance rental properties well. And when equities go down, residential real estate almost always goes up.
Real estate is illiquid compared to equities. You can buy and sell mutual funds, ETFs, or individual stocks at a moment’s notice. Investment property isn’t quite so easy to get in and out of.
Stock investing also offers truly passive income. Ultimately, rental income can never be as passive as dividend income (even with property management handling general upkeep).
It’s much easier to diversify your investment portfolio with stocks, as well. You can spread $500 across thousands of companies, in every region of the world, in every industry, and at every market cap. You’d be lucky to get away with only putting down $5,000 on a single rental property!
Is there a place for stocks in your portfolio?
Residential real estate offers excellent returns with low volatility and huge tax advantages. I love rental properties. But that doesn’t mean there’s no place for equities in your portfolio.
Stocks provide liquidity, long-term growth, easy diversification across sectors and countries, and easy investing via tax-sheltered accounts such as IRAs and 401(k)s. Real estate provides stability, a hedge against inflation, ongoing high-income yields, built-in tax advantages, and diversification from the stock market.
If you invest well, rental real estate starts performing for you immediately. Equities take longer; the stocks you buy today won’t produce significant income for you until 10, 20, or 30 years from now. But the long-term returns will compound for you at prodigious rates, and a diverse portfolio protects you from a crash in a single asset class or market segment.
Build up your retirement account with passive income from rentals and dividends, and when your peers are still working in a decade or two, their incomes tied to GDP growth, you can offer sympathetic words.
And then you can go back to playing golf and relaxing with your children, having reached financial independence.
NREIA Statement on the Biden Administration’s Recent Announcement Regarding Renters & Housing Providers
NREIA Statement on the Biden Administration’s Recent Announcement Regarding Renters & Housing Providers
(Crestview Hills, KY) The National Real Estate Investors Association issued the following statement on the Biden Administration’s recent announcement regarding renters and housing providers:
What Inflation Would Look Like in a True Free-Market Economy
by David Stockman

There is nothing more substantive than Bernanke’s original finger-in-the-air proposition that the Fed needed a 200 basis point cushion in the inflation rate in order to steer the economy clear of the dreaded 0.0% inflation line, the other side of which allegedly amounted to a black hole of deflationary demise.
But here’s the thing. There is not a shred of historical evidence that the US economy needs a 2.00% inflation guardrail to thrive, or any fixed rate of inflation at all.
For instance, even during the most difficult period of the 20th century—from 1921 to 1946 when the US economy experienced the Roaring Twenties boom, the Great Depression bust and the WWII rebound—there was abundant net economic growth over the period as a whole, accompanied by zero inflation.
In fact, the US economy nearly tripled in size during that quarter-century period. Real GDP expanded at a robust 3.64% per annum rate, and real GDP per capita rose by 2.55% per annum.
By contrast, between the 2007 pre-crisis peak and 2021, real GDP grew at only half that rate (1.72% per annum), while per capita real GDP increased by just 1.04% per year. That was just two-fifths of the rate of annual gain during 1921-1946.
Needless to say, it didn’t take any 2.00% inflationary guard rails to generate the salutary outcomes cited above for 1921-1946. The CPI index shown below posted at 542 in February 2021 and 541 a quarter century later in May 1946.
Purchasing Power of the Dollar, 1921 to 1946
![]()
As it had unfolded, there was zero CPI inflation during the Roaring Twenties; a severe deflation during the Great Depression, which merely reversed the war inflation of 1915-1920; and then a return to the 1921 price level during the booming but regimented economy of WWII.
Still, by the spring of 1946 the dollar’s purchasing power was 100% of what it had been in early 1921. It had not taken any net inflation at all to generate a near tripling of the nation’s economic output.
The implication is straightforward. To wit, the Fed doesn’t need a pro-inflation target of 2.00% per annum. Nor does it need any of its other macroeconomic targets for unemployment, jobs growth, actual versus potential GDP or the rest of the Keynesian policy apparatus. All of those variables are the job of the people interacting on the free market, producing whatever outcomes their collective actions happened to generate.
Indeed, macro-economic outcomes are not properly the business of the state at all. The Fed’s job is far more narrow. As originally conceived by its great architect, then Congressman Carter Glass, its mission was to keep the purchasing power of the dollar as good as the gold to which it was to be linked, and the banking system liquid and stable, as driven by the free market of borrowers and lenders.
As we have explained on other occasions, Congressman Glass called this a “bankers’ bank” and the term could not be more diametrically opposed to the central planners’ bank of Greenspan, Bernanke, Yellen, Powell and Brainard.
As Carter Glass saw it, no academician needed to stick his finger in the air and divine an inflation target. Nor did any modeler need to goal-seek his/her equations until they suggested the optimum U-3 unemployment rate relative to an arbitrary inflation target.
The fact is, the free market operating with sound gold-backed money was never inflationary. In that context, interest rates were also not a policy “tool” of the central bank, but the result of a market-clearing balancing of supply and demand.
As Carter Glass had arranged it, the Fed was not allowed to own government debt, nor did it have an activist arm now known as the FOMC empowered to intervene in the money and capital markets by buying and selling debt securities.
To the contrary, its avenue of operation was the discount window at the 12 regional Federal Reserve banks. The latter were authorized to advance funds to member banks, but only at a penalty spread above the free market interest rate, and also only on the basis of sound, self-liquidating collateral in the form of commercial paper that matured within a matter of months.
Given this mechanism, the dynamics of Fed policy were the opposite of today. Under the Glassian arrangement, the Fed’s balance sheet was the passive consequence of free market activity by commercial bankers and main street borrowers, not a mechanism to proactively steer the level of aggregate commerce and business activity.
Accordingly, the Fed’s value added stemmed not from wild-ass guesses about the inflation rate by PhDs like Lael Brainard, but from the grunt work of green-eyeshade accountants. Their job was to verify that bank loan collateral presented for funding at the discount window represented the obligations of sound borrowers, not speculators and high flyers, who would reliably repay under the terms of the underlying bank loan, thereby ensuring that the Fed’s discount loans would be repaid at term, too.
What this meant was that the Fed’s balance sheet was intended to reflect the ebb-and-flow of decentralized commerce and production on main street, not a centralized judgment by 12 people gathered on the banks of the Potomac about whether inflation and unemployment were too high, too low or just right.
That is to say, under the bankers’ bank arrangement the free market put an automatic check on CPI inflation. That’s because unsound speculative loans could not be easily made in the first place, since they were not eligible for discount at the Fed window.
And if demand for even sound loans got too frisky, interest rates would rise sharply, thereby rationing available savings until more of the latter could be generated or demand for the former was curtailed.


